pyPhotometry
Open source, Python based, fiber photometry data acquisition.
Overview
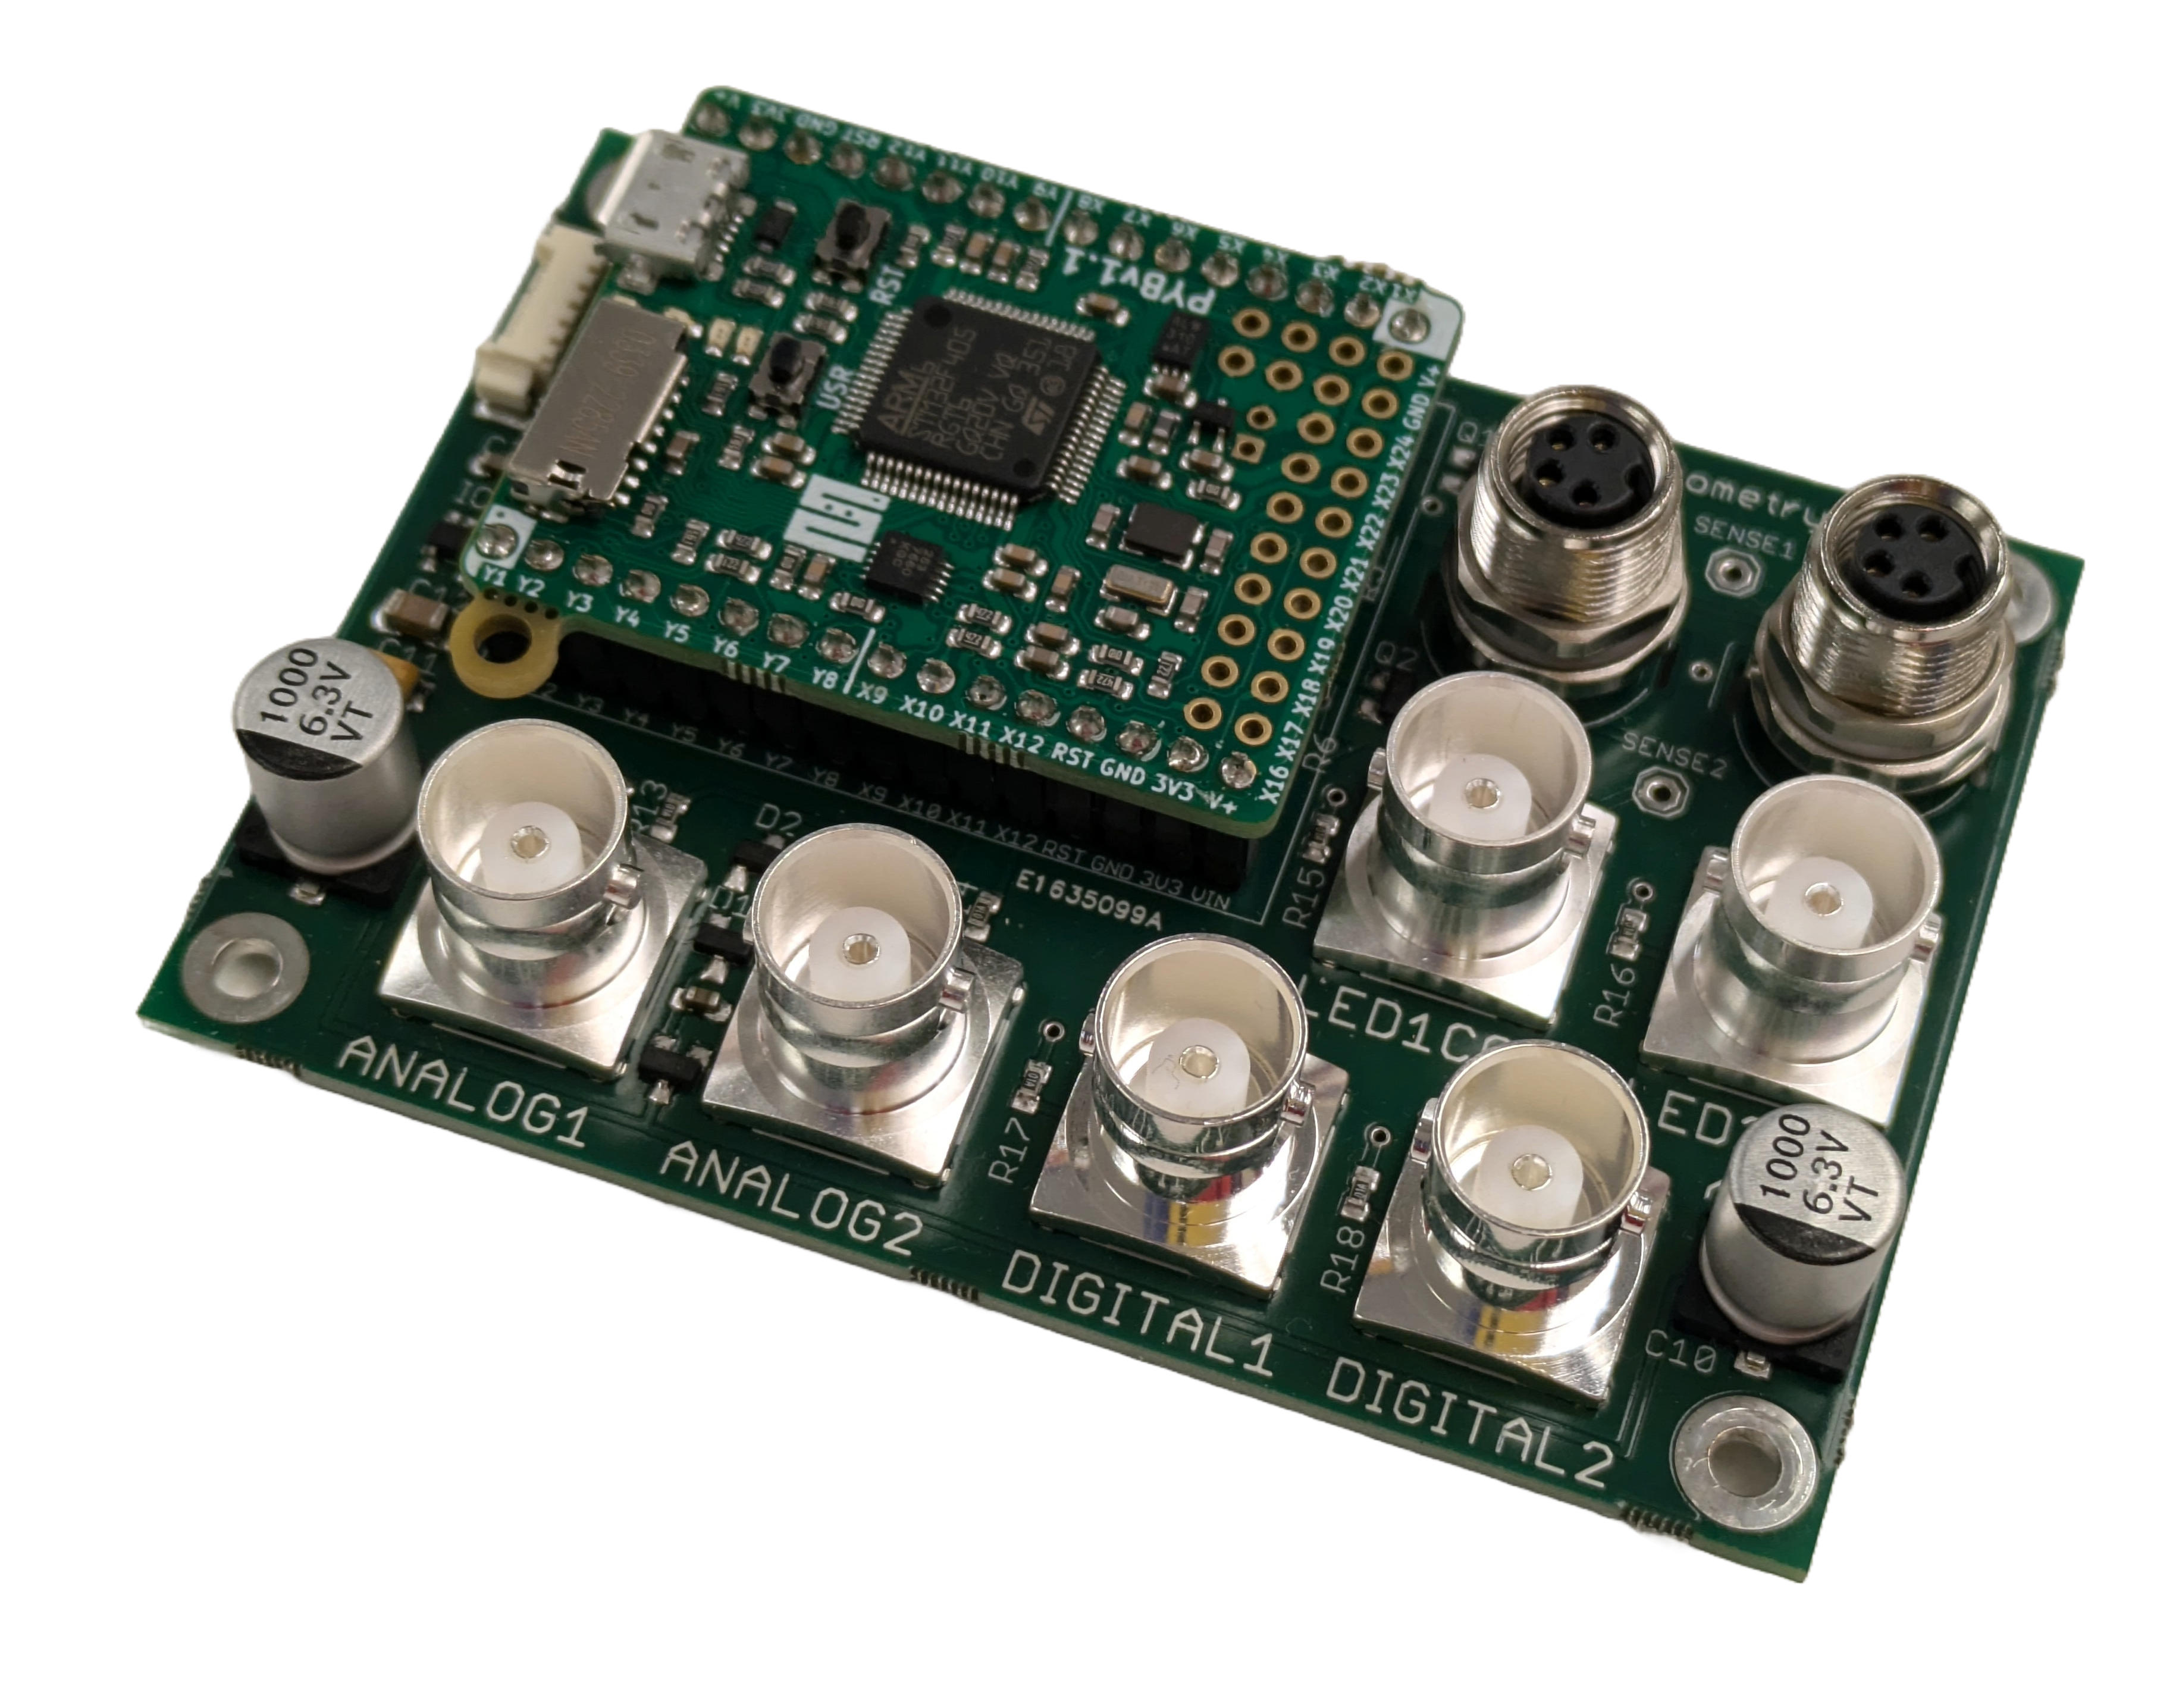
pyPhotometry is system of open source hardware and software for neuroscience fiber photometry data acquisition, consisting of an acquisition board and graphical user interface.
pyPhotometry supports data acquisition from two analog and two digital inputs, and control of two LEDs via built in LED drivers with an adjustable 0-300mA output. The system supports time-division multiplexed illumination which allows fluorescence evoked by different excitation wavelengths to be independently readout from a single photoreceiver signal. Assembled acquisition boards are available from the Open Ephys store and Labmaker.
pyPhotometry hardware, software and documentation repositories are hosted on GitHub, along with a discussion board for user support and questions.
The pyPhotometry manuscript has validation experiments characterising system performance, and information about the multiplexed illumination acquisition modes. If you use pyPhotometry in a publication, please cite it.
If your experiments involve behavioural tasks, you may be interested in pyPhotometry's sister project pyControl, a Python based system for controlling behavioural experiments.
Getting started
Dependencies
pyPhotometry has the following dependencies:
- Python 3
- pyserial
- numpy
- pyqt6
- pyqtgraph
On a windows machine that does not already have Python installed, the simplest way to install Python is to download an installer from python.org. To ensure you can run Python files (including the pyControl GUI) by double clicking on them, select the options 'Add Python to PATH', 'Add Python to environment variables', and 'Associate files with Python' during installation. Note; selecting these options when installing Python will cause the Python version you are installing to take precedence over any other version of Python installed on the computer, so may break previous Python based workflows on the computer.
Once you have a working Python 3 installation on the computer, run the windows command prompt (cmd.exe) as an administrator and enter the following commands to install the required packages:
python -m pip install numpy
python -m pip install pyserial
python -m pip install pyqt6
python -m pip install pyqtgraph
pyPhotometry has been tested primarily on Windows 10 but in principle should be cross platform.
Installation
Get the latest version of pyPhotometry, either by downloading it at a zip file from the releases page or by cloning the code repository to your computer with Git. Cloning the repository is recommended as it makes it easier to update pyControl in the future. pyPhotometry is in active development with new versions released from time to time. The default documentation is for the latest release, but the dropdown menu in the bottom right corner of the docs lets you access documentation for earlier versions, and for the dev branch of the code repository where new features are developed.
Either way you obtain the code, you will have the following folder structure:
- config             # Configuration files
- GUI                # Graphical user interface code.
- uPY                # Code that runs on the Micropython Microcontroller.
- tools              # Tools for importing pyPhotometry data.
- data               # Default data directory.
- experiments        # Where experiment configurations are saved.
pyPhotometry_GUI.pyw # Python script to launch the GUI.
Hardware
The acquisition board can be purchased from the Open Ephys store for €364 or built from components. The acquisition board needs to be paired with additional optical components to make a complete system, see the Optical Components resources page for more information.
Running an experiment
Load the GUI by running the file pyPhotometry_gui.pyw.
Select the Setups tab, then connect a pyPhotometry acquisition board to the computer with a USB cable. You should see the board show up in the table on the setups tab. You can give the setup a name which will determine how it appears in the GUI, and select whether it is a v1.0 or v2.0 acquisition board (see Hardware).
Select the Acquisition tab, you should see the name of your setup in the drop down menu next to the Connect button. Press the Connect button to connect to the board.
Select the data acquisition mode, for more information see the GUI user guide.
Press Start to start data acquisition.
Adjust the LED currents (and photoreceiver gain if applicable) to bring the signals into the centre of the 0 - 3.3V range covered by the analog inputs. If an input signal exceeds 3.3V it will be clipped, and a warning will be shown in the signal plot indicating which channel is clipping. If the signal is very low the signal to noise ratio will be less good. When adjusting the LED current it is recommended to use the 2EX_2EM_continuous acquisition mode as this mode does not use baseline subtraction so the signal you see is the raw photoreceiver voltage.
To record data enter a subject ID and data directory and press Record.
For information on opening data files generated by pyPhotometry see Importing data.
If you encounter problems take a look at the troubleshooting page or post on the discussion board.
System testing
If you are new to pyPhotometry, we recomend doing the following steps to build understanding of the signals, and test your optical setup is working as expected.
-
Put the system in
2EX_2EM_continuousmode and wave the fiber tip around, you should see the signal levels go up and down as the tip is oriented towards and away from light sources in the room. If the light in the room is bright you may well see a warning indicating that the signal is clipping. -
Put the system in
2EX_1EM_pulsedor2EX_2EM_pulsedmode, depending on your whether you are using one or two photodetectors. These modes use background subtraction, i.e. they subtract the signal level with the LED off from the value with the LED on, to remove the influence of background illumination. Therefore when you move the tip around the signal should stay constant (though if you point the fiber tip at a bright light, the background subtracted signal may drop to zero due to the raw signal saturating, and the clipping warning will show). -
Even using background subtraction, and with nothing in front of the patch cord, the signal will not be zero due to autofluorescence from the patch cords themselves. The brightness of the autofluorescence depends on the illumination intensity and wavelength (shorter wavelengths typically evoke more autofluorescence). Increase and decrease the LED currents and check that the corresponding signal levels change.
-
Touch the tip of the patch cord onto a sheet of white paper, you should see the signal levels go up due to fluorescence of the paper.
If the above steps look good you are ready to try and record brain signals.